

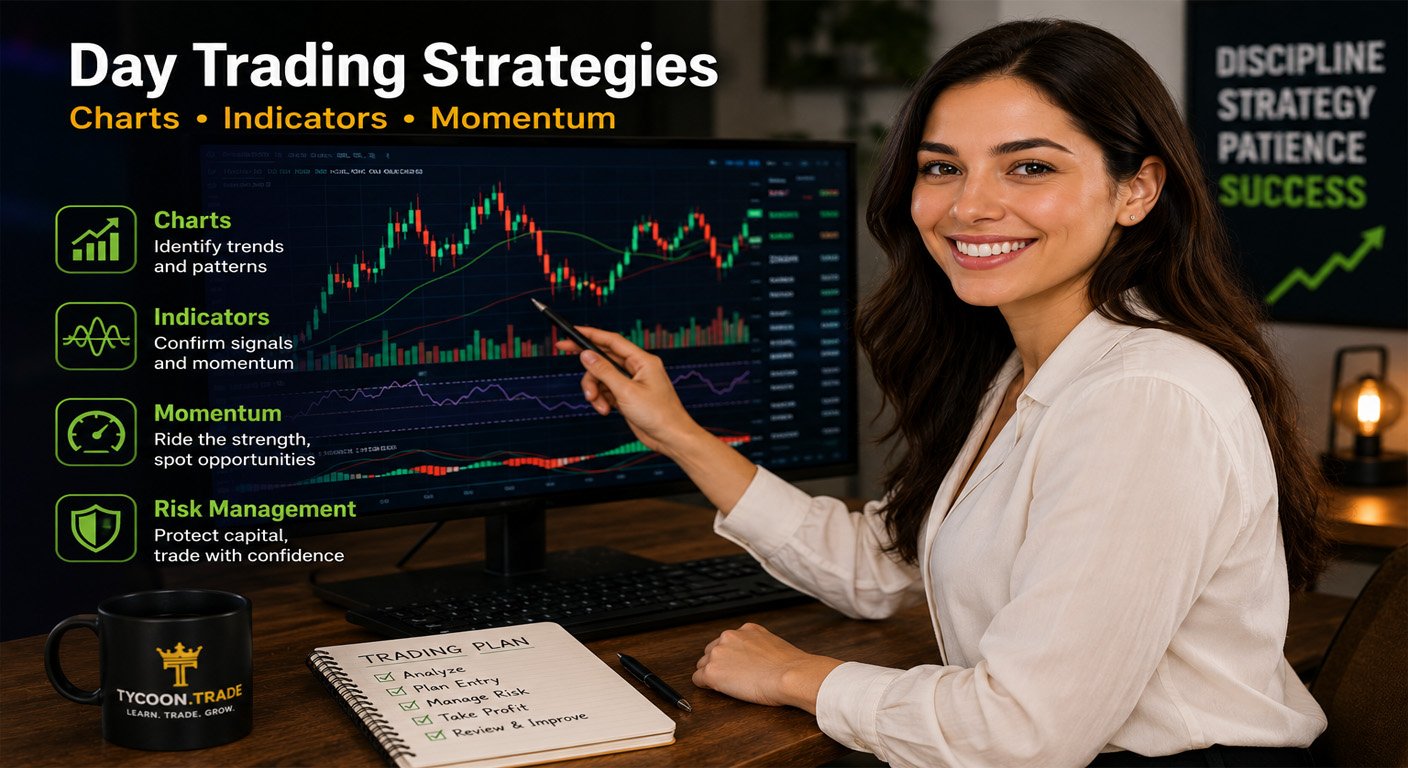
Day traders rely on fast decisions, clear setups, and disciplined risk management. While no chart or indicator can guarantee a winning trade, technical analysis can help traders identify potential opportunities, understand price behavior, and avoid random guessing.
Tycoon.Trade teaches that smart day trading is not about chasing every price move. It is about learning how charts, indicators, volume, and momentum work together so traders can make better-informed decisions.
What Is Day Trading?
Day trading is the process of buying and selling financial assets within the same trading day. Day traders may trade stocks, forex, crypto, ETFs, or other markets. The goal is usually to profit from short-term price movement.
Because day trading moves quickly, traders need a plan before entering the market. Without structure, beginners can easily make emotional decisions and lose money.
Why Charts Matter in Day Trading
Charts show how price has moved over time. They help traders identify trends, reversals, support levels, resistance levels, and possible breakout areas.
Common chart types include:
- Candlestick charts: Popular among traders because they show open, high, low, and close prices.
- Line charts: Simple charts that show price movement over time.
- Bar charts: Detailed charts that also show price ranges for each time period.
Understanding Candlesticks
Candlesticks help traders see buying and selling pressure. A strong green candle may show buyer strength, while a strong red candle may show seller pressure. Long wicks can suggest rejection or hesitation at certain price levels.
Beginners should not rely on one candle alone. Candlesticks are more useful when combined with trend, volume, support, resistance, and risk planning.
Support and Resistance
Support is an area where price has previously found buying interest. Resistance is an area where price has previously faced selling pressure.
Day traders often watch these areas because price may react near them. A breakout above resistance may suggest strength. A breakdown below support may suggest weakness.
How Indicators Help Traders
Trading indicators are tools that use price, volume, or mathematical formulas to help traders interpret market behavior. Indicators should not be treated as magic signals. They are best used as confirmation tools.
Moving Averages
Moving averages smooth price action and help traders identify the direction of a trend. If price stays above a moving average, traders may view the trend as stronger. If price falls below it, traders may watch for weakness.
Relative Strength Index
The Relative Strength Index, also known as RSI, helps traders evaluate whether an asset may be overbought or oversold. It can also help reveal momentum shifts.
MACD
The MACD indicator can help traders evaluate momentum and trend changes. Some traders use MACD crossovers or histogram changes as part of a broader strategy.
Volume
Volume shows how much trading activity is happening. Strong price movement with high volume may be more meaningful than price movement with low volume.
Momentum Trading Explained
Momentum trading focuses on assets that are moving strongly in one direction. Day traders may look for stocks, crypto, or forex pairs with unusual volume, strong news catalysts, or clear trend movement.
Momentum can create opportunity, but it can also reverse quickly. Traders should always know where they will exit before entering a momentum trade.
What Day Traders Look for Before Entering a Trade
A disciplined trader may look for several forms of confirmation before entering:
- Clear trend direction
- Support or resistance level
- Strong volume
- Momentum confirmation
- Defined stop-loss level
- Acceptable risk-to-reward ratio
Example of a Basic Day Trading Setup
A beginner-friendly example might look like this:
- Price is trending upward.
- Price pulls back near a support level.
- Volume increases as buyers return.
- A bullish candlestick forms.
- The trader sets a stop-loss below support.
- The trader only enters if the possible reward is greater than the risk.
This does not guarantee success, but it creates a structured decision instead of an emotional guess.
Common Mistakes with Charts and Indicators
Many beginners overload their charts with too many indicators. This can create confusion instead of clarity. Others enter trades because one indicator gives a signal, even when the broader market does not support the trade.
Common mistakes include:
- Using too many indicators
- Ignoring volume
- Trading without a stop-loss
- Entering after momentum is already fading
- Confusing a lucky trade with a strong strategy
- Ignoring risk-to-reward
Risk Management Still Comes First
Charts and indicators can help traders identify possible setups, but they do not remove risk. Every trade can lose money. That is why risk management should come before profit targets.
Smart day traders often use:
- Position sizing
- Stop-loss planning
- Daily loss limits
- Trade journaling
- Emotional discipline
How Tycoon.Trade Can Help Day Traders Learn
Tycoon.Trade can help beginners understand charts, indicators, and momentum through simple educational resources. The site can become a learning hub for traders who want clear explanations without unrealistic profit promises.
Helpful resources could include:
- Candlestick chart tutorials
- Indicator comparison guides
- Momentum trading lessons
- Support and resistance examples
- Trading journal templates
- Risk management worksheets
Final Thoughts
Day traders use charts, indicators, and momentum to make better decisions, but no tool guarantees a winning trade. The best traders combine technical analysis with patience, discipline, and strong risk control.
If you want to trade like a market tycoon, learn the tools, practice carefully, protect your capital, and never let emotion replace strategy.
Disclaimer: This article is for educational purposes only and is not financial, investment, tax, or legal advice. Day trading involves significant risk and can result in financial loss. Always do your own research and consult a qualified financial professional before making trading or investment decisions.
Tycoon Related Articles